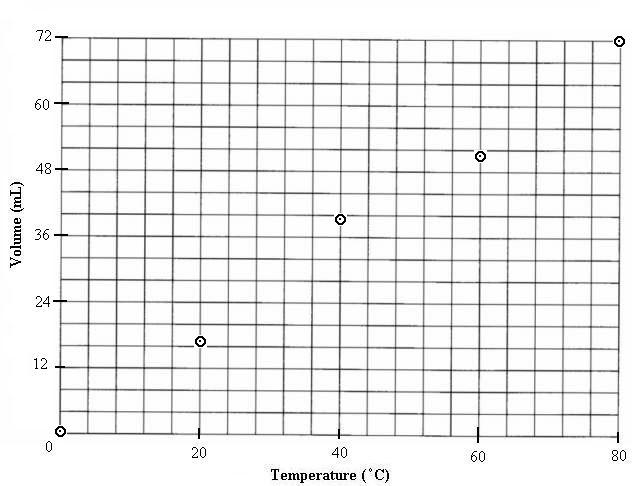
When you plot data on a graph you should mark the point and then
place a "point protector" around it. This is simply some shape that does
two things: (1) let's you know it is a plotted point not a stray mark on
your paper and (2) allows you to plot multiple data sets on one graph by
using different shapes for each set of data. The most common point protectors
are the circle, square, triangle, and asterisk. Other than that you can
be somewhat creative if you wish.
For our example we are only plotting one set of data.
Next you want to draw the "best fit curve" for the data or connect the
points.